Have you ever felt intimidated to try out and learn a new deck? Has the itch to gain LP on the ranked ladder stopped you from taking the new deck everyone is talking about for a spin?
Or have you dropped a new deck after five or six games, grunting to yourself in frustration - “this crap doesn’t work!”?
Would it help you to know, at least roughly, how many games it will take before you reach the “average winrate” for a new deck that we see in the weekly metagame reports?
Fear no more!
In this article, we'll see:
- what Mastery Curves are;
- what the data suggests about how many games it takes to reach a new deck’s expected mean winrate; and
- how you may actually be denying yourself an advantage against other card slingers by not trying to learn new decks!
We’re going to rewind to the start of A Curious Journey’s release, but first, a look ahead.
A major balance patch is approaching Runeterra, and we are expecting changes to thirty-three cards. We anticipate it will include nerfs to problematic cards in the format and buffs to under-used cards that have the potential to shake up the metagame.

Looking at More_Synergy’s Reddit post, I don’t know about you, but I’m not sure what a “neat little balance experiment” is. Whatever it may be, I’m excited about it!
Mastery Curves
Before I go on any further discussing Mastery curves, I have to say: anything and everything I know about Mastery Curves comes from my friend, Legna, who was kind enough to collaborate with me on this effort. I’ve read his exploratory Analysis on Mastery Curves article at least five times and I also asked him many questions about his most recent analysis. To be clear, his analysis was done for this article so I get the honor of talking about it!
What is a Mastery Curve?
Definition: It is the approximate relationship between the number of games played and the player’s winrate with a specific metagame deck.
Before continuing down the path we set out on, we need to ask ourselves: “Why is the number of games a deck is used by a player important?” Let’s go over a graph to give us an idea and get us warmed up for the main dish!
Game Density Curve
For this analysis, strangely enough, it’s best to have a spread of a varied amount of players with a different amount of games played using the deck in question.
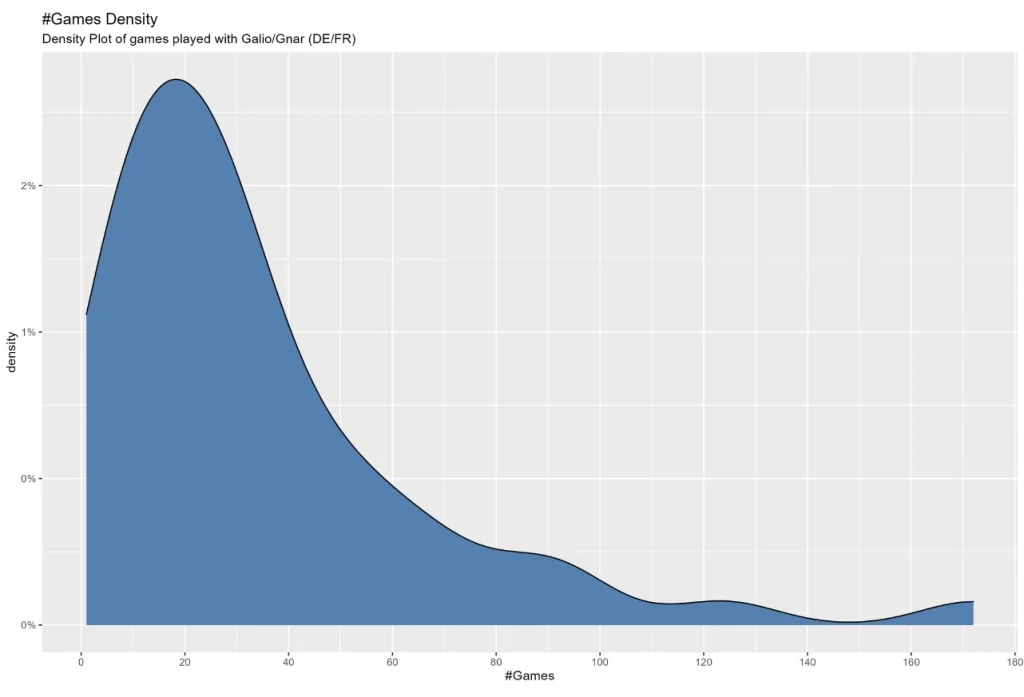
To give you an idea, this is what that spread looks like in graphical form for Galio Gnar DE/FR, but please don’t focus on this graph.
- This chart supports the Total Games axis on the Mastery Curve graph (further explained below), and it tells us how many players played the deck for exactly one game, exactly two games, exactly three games, and so on;
- It appears there are two groups here, those who played twenty games or less with the deck and those who played more than twenty games;
- The volume of games for this deck appears to be larger under the curve beyond the twenty-game mark;
- It’s also apparent some players might like this deck and maybe they’re even climbing the ladder with it!?
The Main Dish - Mastery Curves
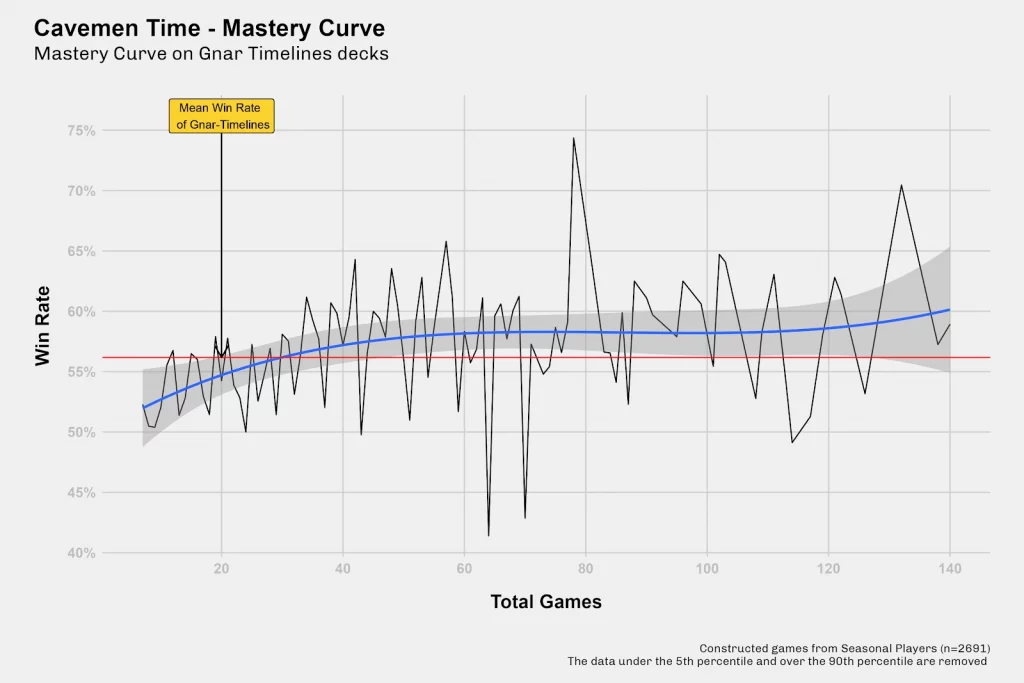
Here is the Mastery Curve for Trundle Gnar
Gnar Concurrent Timelines
 , which is also part of the analysis, that Legna provided to me. I’m sharing it now so that it’s not too abstract, and it’s easier to visualize, break it down, and discuss.
“Oh man, bA1ance, what are we looking at here?”
Alright, let’s break it down, bit by bit, including how it was put together so that we can understand it. With a solid grasp of this one, we can take a look at the Mastery Curves for the other new decks that emerged into the metagame with A Curious Journey.
The focus here will be on the blue line, but I need to give you as much context as I can to make the concept clear. After going over the basics of Mastery Curves, I will also share information on what the related challenges to analyzing, creating, and placing them into the proper context are so that we make sure to look at the big picture.
Deck Name — this is the deck in question: here we have Trundle Gnar
Gnar Concurrent Timelines
 , or as Legna has affectionately named it, Cavemen Time!
Red Line — this is the mean, or average, winrate across the analyzed players.
Notes — in case you’re wondering which players were analyzed, we have answers!
- Legna tracked the constructed games during A Curious Journey for the participants from the Magic Misadventures (last season’s) Seasonal tournament, however, only 2,691 players are included;
- The data under the 5th percentile and over the 95th percentile have been removed;
- This has been done since including that data makes the overall model worse, and also because it has trends that makes the Mastery Curve’s behavior irregular.
Total Games (X-Axis) — the maximum amount of games with the new deck by each player being analyzed. If you have any questions on this, please refer back to the Game Density curve, above.
Win Rate (Y-Axis) — by definition, and I’m only looking at the axis itself, winrate is the percentage of games won divided by the number of total games played.
Black Dots (ignore the Black Line) — these are the actual winrate for the sample population at each point along the Total Games axis. The black line only connects the points and there are no conclusions we can draw from it.
- To clarify, we are looking at the winrate for the players that played exactly one game with the new deck, then the players who played exactly two games with the new deck, the players who played exactly three games with the new deck, etc.
Blue Line / Mastery Curve — the estimated relationship between the number of games and winrate, also known as the Mastery Curve
- But, but, bA1ance: why does the blue line turn downwards at the end [in some cases]? Does the winrate go down, possibly, as the metagame changes?
- <Checks notes…then checks with Legna> in short, we don’t have enough data. Also, the difference in winrate is small;
- With just a few unlucky cases under the mean on the most right-side values, the curve will tend to follow them;
- The steeper, or faster, it climbs would suggest that a deck is not too difficult to learn and not as many games will be needed to play it optimally.
Error Band — this is the gray-highlighted area above and below the Mastery Curve; the narrower this gray zone is, the more accurate the Mastery Curve is.
With the components of the Mastery Curve explained, let’s look at the results and revisit the caveats and challenges to conducting this type of analysis, to make sure we don’t interpret things that aren’t supported by the data.
Results and Conclusions
Here are the remaining Mastery Curves for new decks that were valid to analyze (I’ll discuss more on the methodology to identify these decks below):
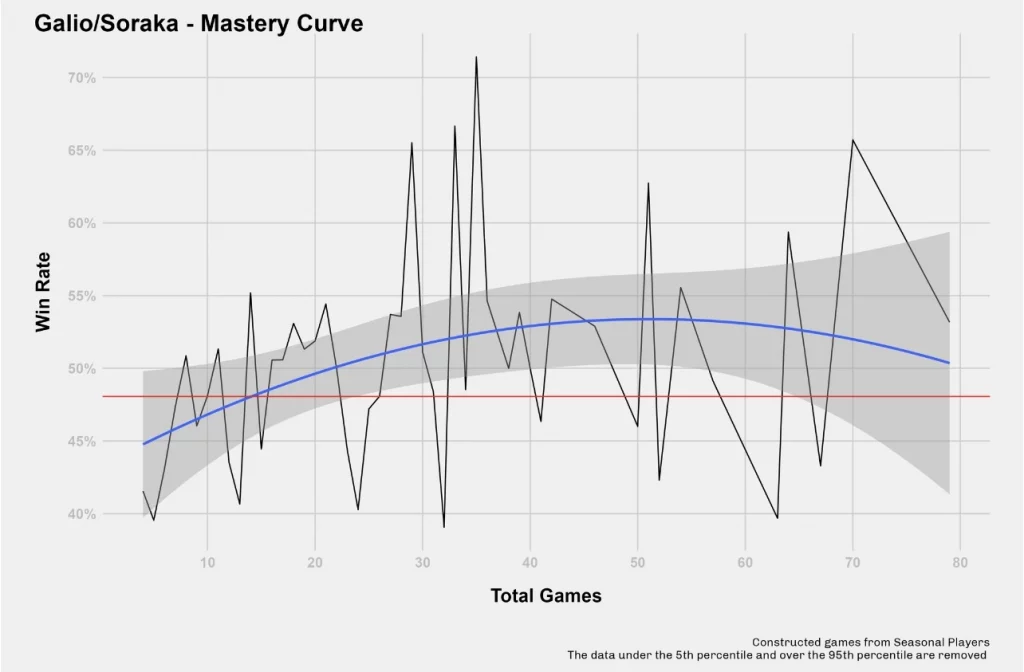
Galio / Soraka
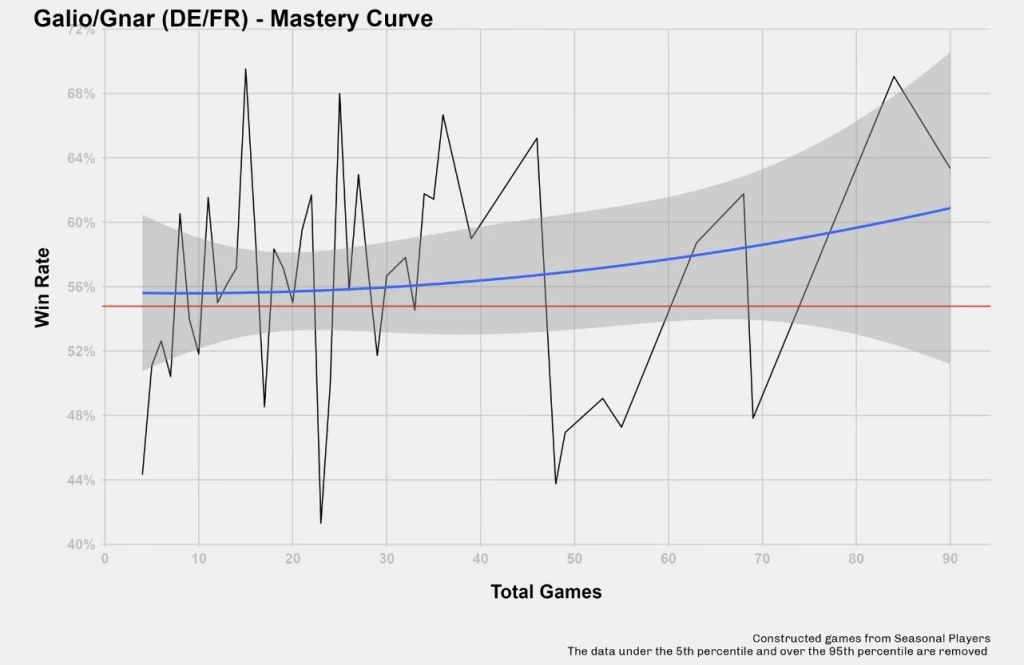
Galio / Gnar (DE/FR)
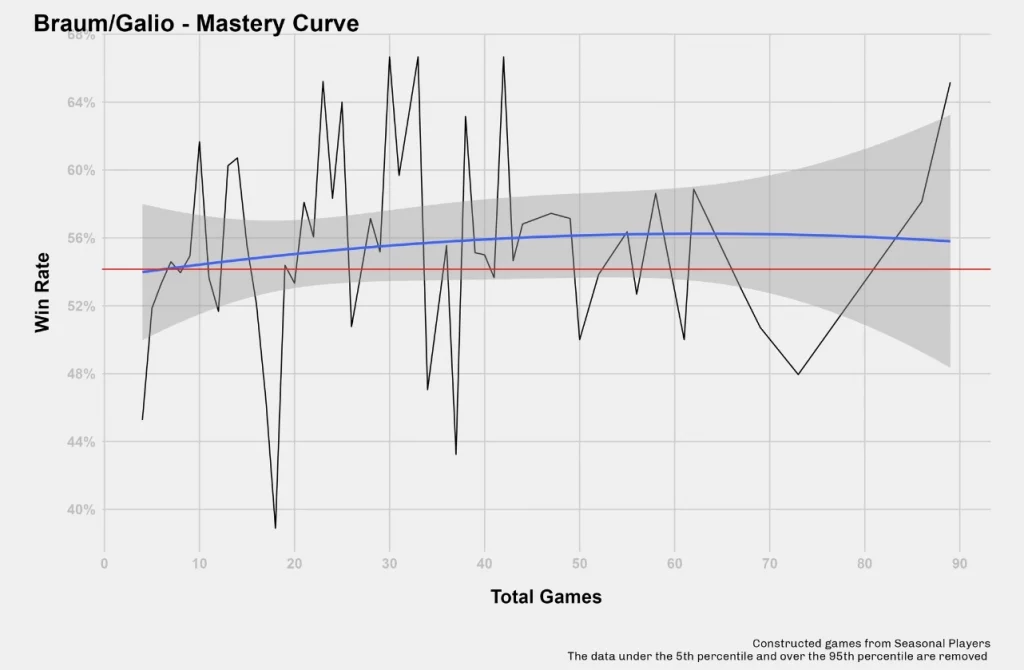
Braum / Galio
Galio / Udyr
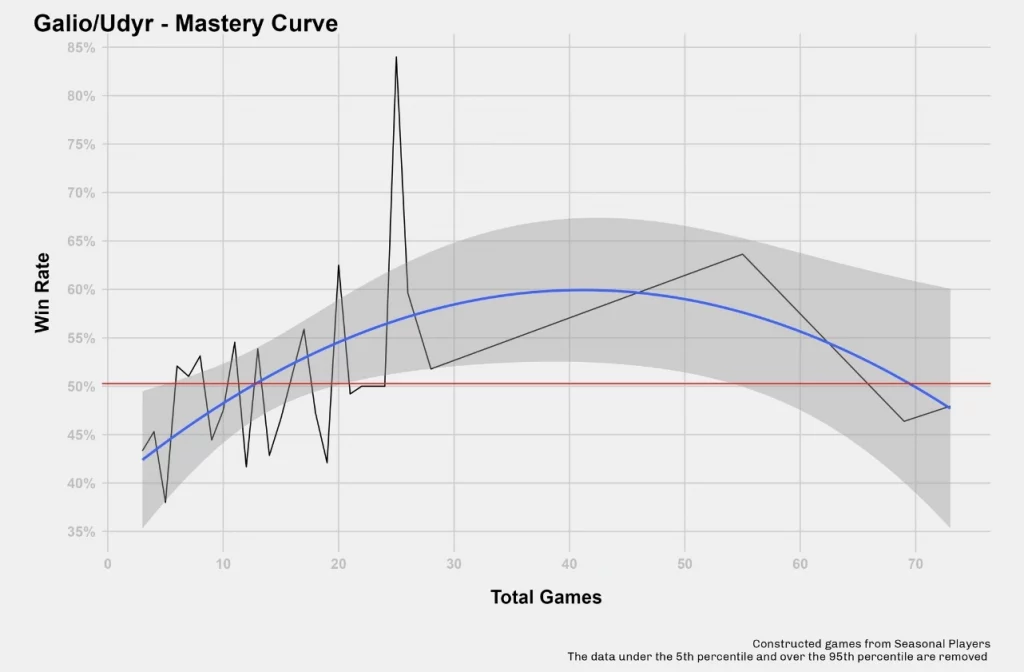
Legna was also kind enough to interpret the data and summarize the results and conclusions we can draw.
- Playing more games with a new deck almost always helps;
- From the examples, the only ones that are not affected by much start off strong and remain strong (such as with Galio
 / Braum
 or Galio / Gnar
 );
);
- From the examples, the only ones that are not affected by much start off strong and remain strong (such as with Galio
- When a deck starts off weak, or rather with a low winrate, it usually takes at least 20 games to reach the average winrate for the deck;
- Gnar Trundle Timelines seems to be a strong deck — this helped the analysis with a good data spread, however, the Mastery Curve for it suggests it also has a slow-climbing learning curve and needs some experience to use it to its full potential;
- The Galio Udyr deck may actually be strong and players just dropped it too early, or stopped playing it without having enough experience with the deck.
You may have noticed I haven’t discussed much about the initial steps of the analysis yet and that’s on purpose. My idea was to get to the punch line and then discuss some of the finer points. I would be remiss to not discuss the caveats and challenges to conducting an analysis of Mastery Curves, so let’s go into it.
Caveats
There are conditions and limitations that are important everyone is aware of, so I’ll list them here:
- It’s ideal to analyze new decks so that we’re not concerned that prior knowledge translates to the current metagame;
- It’s difficult to identify these new decks, but it helps to focus on new champions and / or new win conditions, such as The Bandle Tree (but there were none this set);
- Note that if there had been, the assumption is that the region pair doesn’t have a big impact on the Mastery Curve;
- We can’t use Ahri decks because of the balance change to her, even though she was used in other decks at the start of this season;
- Yuumi’s best champion to pair with is Pantheon, however, her presence doesn’t change the deck much, so prior knowledge is an issue — that is to say, we can’t use her in the analysis;
- Good champions to analyze are Galio and Gnar;
- We needed to focus on what is likely the best Gnar deck, so we looked at Trundle Gnar Timelines;
- In general, statistics help us draw conclusions from smaller sample sizes, however, taking the numbers at face value without interpreting them is a bad move;
- Reflecting on the Mastery Curve, the increase in winrate will disappear after a certain [varying] number of games [depending on the deck].
In addition to the information above, the following information extracted from Legna’s Mastery Curve Analysis also helps us understand Mastery Curves and their importance further:
- A deck’s winrate is valuable information, but often it doesn’t tell the whole story;
- If we look at the Lee Sin / Zoe example from over a year ago, it had approximately a 50% winrate, but was considered to be a top tier tournament deck;
- Why was this? In part, it was a top deck in a controlled format (best of three match, ban one deck), and new players that used the deck in ranked play likely brought its average winrate down;
- It was a common opinion that Lee Sin / Zoe required many games and / or hours required to use the deck to its full potential;
- Using Lee Sin / Zoe to its full potential was thought to go so far as to change how favored a matchup could be, even changing unfavored matchups to be favorable;
- However, there was no hard data to backup the claim (regarding deck experience). Does that make it less valid?
- Having a large enough sample size makes the analysis more stable and / or clear;
- The data suggests there is an initial increase in mean winrate compared to later results.
Challenges
These are the potential issues and challenges that are faced when performing a Mastery Curve analysis:
- Collecting the game data;
- Who should we collect for? Also, making sure we get all of the data — although the data exists, limitations with Riot’s API and setting up a proper database are an issue;
- Properly identifying which decks to analyze;
- Did prior knowledge for the deck(s) exist?
- The play rate for the deck in question — maybe it was very unpopular, for example like Lulu Jinx a few seasons ago, so a good spread of players and number of games might not be available;
- The number of decks to examine;
- Only examining one deck means we have no other context, but analyzing a handful of decks doesn’t give us a lot of information still;
- Any balance patches and / or mini-expansion releases;
- While a deck may or may not change, the metagame can also change — making the deck well-positioned or poorly-positioned (changing the average winrate)
- A problem at the root of the Mastery Curve analysis is that we’re missing the complete, true history for the players — the data exists but we don’t have it. Am I saying this loud enough, Riot?
Conclusion
Although there may be more questions on our mind now than before, and please do ask them in the comments or reach out to me on Twitter (@bA1anceLoR), or on Discord (bA1ance#0143), we can rest with confidence knowing that it pays off to try and learn new decks!
That’s right, don’t give up too early, five to ten games with a new deck is too few. You should be able to play a deck as well as anybody else after about 20 games. In case you need encouragement, I found this tweet last night and my mind was blown!
Reject the meta
— THC Torra (@SaltyTorra) March 27, 2022
Embrace Formidable
I'm proud to have hit 1,000 LP for the first time in my days as a competitive player, made better by getting there with my own brew of Braum Galio (aka Tank City)
Big thanks to @Aeolius_LoR for helping me refine the Braum Galio list ❤️ pic.twitter.com/tTlZXLkFtu
Long story short — don’t give up on a new deck too soon!
